Crash Course Into Open Source Monitoring - Part 2
Metrics
Metrics are the foundations of monitoring. In order to determine whether something is working, you need to be able to measure it, and often correlate it with other data. Beyond that, historical metrics are also a great source of information for predicting potential problems (via trending), anticipating scaling needs, and optimizing performance. Metric systems consist of two parts: storage/visualization and collection.
List of Open Source Tools
- Graphite: http://graphite.wikidot.com/
- StatsD: https://github.com/etsy/statsd/
- collectd: http://collectd.org/
- Diamond: https://github.com/BrightcoveOS/Diamond
- OpenTSDB: http://opentsdb.net/
- Yammer Metrics: http://metrics.codahale.com/
Storage and Visualization
If you’re going to collect metrics, you need a central system to store and visualize them. Often you’ll also need to apply mathematical functions (remember derivatives in calculus?) to these numbers, so finding the right tool for your needs is important. Two popular systems for this are Graphite and OpenTSDB. At a high level, they accomplish similar goals, but their implementations differ quite a bit.
Graphite is a self-contained software system that consists of a front-end, a custom backend storage application called Carbon, and a fixed-sized database called Whisper (similar to RRD). It has a simple protocol for ingesting metric data, and there are many systems that already do this. Furthermore, it has a very nice URL API for retrieving data from the system, which can be used to integrate with other tools. Since it uses a fixed-sized database, it applies retention specifications or downsamples older metric data according to your configurations. This typically means that you’ll have fine resolution metric data immediately which gets more coarse over time.
OpenTSDB is a distributed and scalable Time Series Database (TSDB) written on top of HBase. As such, running this systems introduces a bit more complexity, but what you gain is a very scalable database for storing metrics, and as a result no downsampling is needed. Just keep adding more nodes to your HBase cluster and scale it horizontally. You’ll also benefit from a large community, and tools supporting HBase and Hadoop. A common complaint of OpenTSDB is its front-end and querying interface, especially when contrasted against Graphite’s built-in UI or the many others out there.
Regardless of which tool you choose, having a system for storing and visualizing metrics should be one of your first goals for building a comprehensive monitoring solution that works for you.
Collection
Once you’ve set up a system for storing metrics, you need a way to push data into it. This data can be anything from CPU, memory, network, I/O, load, disk, or even business/application level metrics such as number of purchases, signups, checkouts, etc.
Systems for collecting and publishing metrics include StatsD, collectd and Diamond:
- StatsD is a daemon that aggregates statistics and publishes them to Graphite (or other backends) using UDP and a simple protocol that accommodates a few metric types. It’s very simple to push data to, and comes with many clients for different languages.
- Diamond is a tool that’s very similar to collectd, except that it’s written in Python (which could make it a better fit for your company), features a nice API for implementing custom collectors, and feeds data to Graphite through its more efficient pickle protocol.
- collectd operates as a daemon process that periodically collects statistics about the server its running on, and publishing them to graphite (or again to other backends).
Systems Overview
In each of these diagrams, graphite01 represents a single server hosting all of the processes that make up Graphite: whisper, carbon, and the front-end. A high level diagram can be found here. More complex deployments of Graphite are possible, but for the purposes of this document, they’re collapsed into a single server.
Basic Graphite setup
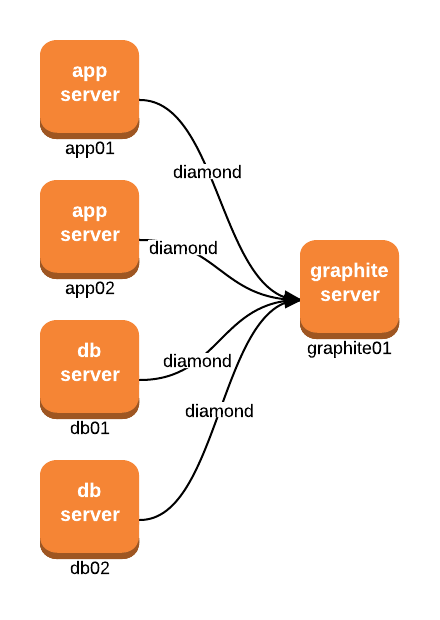
- Diamond, or collectd, are daemons (processes) run on the actual servers. Then at configured intervals (say every 30 seconds), they collect metrics and report to
graphite01. - A default Diamond install will collect system metrics like CPU, RAM, IO, disk space, etc. For a complete list of built-in collectors, check out this page.
StatsD setup
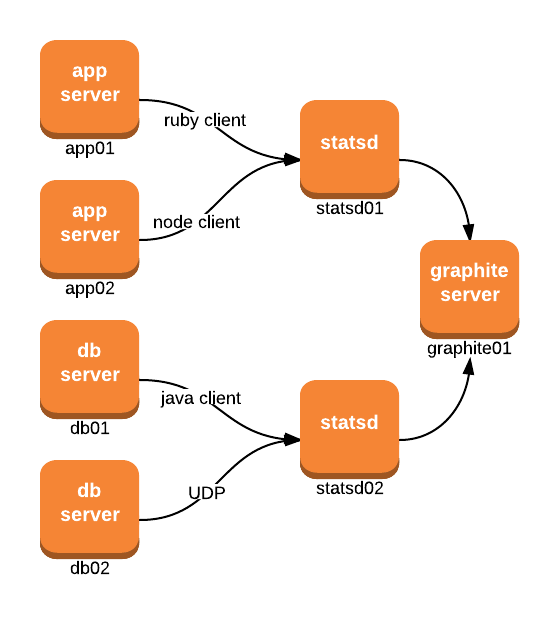
- Although
statsd[01-02]are represented as their own servers in the diagram, they’re actually just processes that can run anywhere. - You can run one statsd process or multiple, depending on your network topology, scaling needs, etc.
- Statsd also supports different backends.
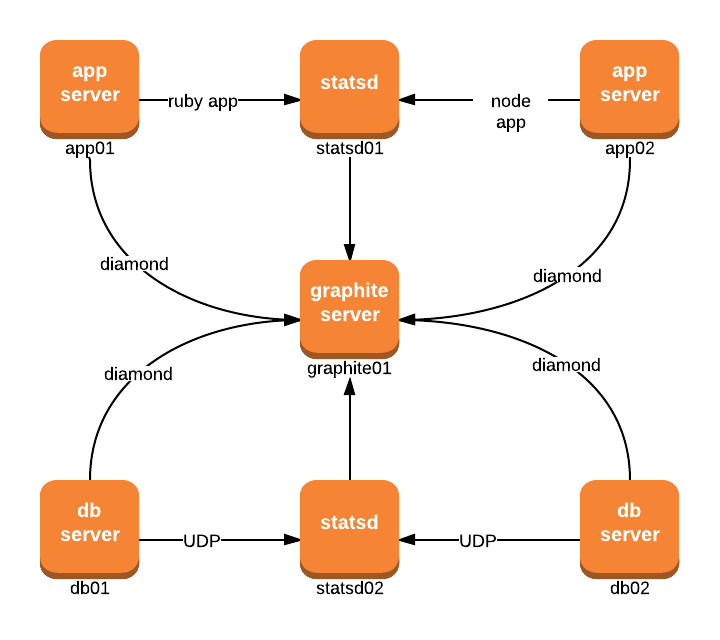
Graphite and StatsD hybrid setup
The previous two setups aren’t mutually exclusive. They can be combined to create a hybrid setup, where some metrics get reported through statsd (for example, custom application metrics reported directly by the apps), while diamond collects others (like system level metrics).
Metrics (Java library from Coda Hale)
Metrics is a great Java library for recording and exposing metric data of your application. With its built-in types of gauges, counters, meters, histograms, timers and health checks, you can record metrics and report them in different ways. If your application is a REST service, then reporting via HTTP servlet as JSON data is probably the way you want to go.
For example, visiting http://app01.example.com/metrics could output the following metric data:
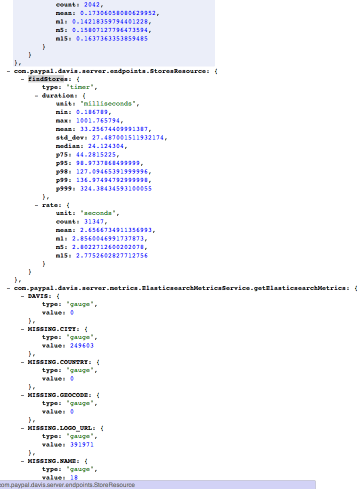
The metrics that an application reports can be anything from JVM/GC stats, HTTP response codes, response/throughput to/from clients and backend data services, or even application/business level metrics, such as number of check-ins, sign-ups, searches, etc.
Keep in mind that this is an instantaneous view of your application metrics that’s stored in memory. If you want to persist this data and query it historically, then you’ll need to feed it into another system like Graphite, and possibly using a custom diamond collector.
Although Metrics is a Java only library, its underlying value is in defining a convention for defining metric data. These ideas are already starting to integrate into other languages like Ruby. Eventually as more languages adopt this method, and platforms begin to ingest the metric data, then a more comprehensive ecosystem can emerge.
Check out Crash Course Into Open Source Monitoring - Part 3 (Centralized Logging) for the next write-up in this series
Resources
- Measure Anything, Measure Everything (from Etsy): http://codeascraft.etsy.com/2011/02/15/measure-anything-measure-everything/
- Metrics: http://metrics.codahale.com/
- Metrics Everywhere (presentation by Coda Hale): PDF / Video