Crash Course Into Open Source Monitoring - Part 3
Centralized Logging
Almost all applications, regardless of language, output log data (typically) consisting of semi structured text. Depending on how much thought and time was put into the setup, an application can output this data in many ways:
- To standard streams and piped to nothing (essentially lost).
- To standard streams, logged directly to flat files in a configured path (like
/var/log/), or to syslog. - Aggregated to a central server via Syslog or similar protocol.
- Aggregated, parsed, and made searchable by a central system like Logstash or Graylog2.
The time, learning and infrastructure investments for each of these approaches vary from low to high. For production systems, centralized logging will always be a valuable tool for operations people and developers alike.
Log Data Types
System
On *nix based servers, system logs are typically located under the /var/log/ directory. Within it, you’ll find many OS and application level files collecting log data.
Application
Applications will output log data specific to the language in which they’re built. However, there are some conventions that are usually followed such as different tunable levels. This type of log data consists of information such as error outputs, stacktraces, performance, tracing, or debug data all defined by the developers of the application. Java applications, for example, will typically use some kind of log abstraction (or convention) library like SLF4J.
ERROR [2013-10-21 16:44:31,639] com.paypal.davis.common.jersey.DavisRuntimeExceptionMapper: Internal server error
! com.paypal.davis.common.search.SearchIndexException: Error encountered while searching for stores with the following query:
StoreLocationQuery{name=null, lat=-33.870814, lon=151.20239300000003, zipcode=null, eligibilityCountryCode=null, radius=30000.0, orderBy=DISTANCE,    size=20, pageNumber=0, categoryIds=[], offerTypes=[], paymentTypes=[], incentiveCampaignIds=[]}
ERROR [2013-10-21 16:43:57,094] com.paypal.davis.common.jersey.DavisRuntimeExceptionMapper: Internal server error
! com.paypal.davis.common.search.SearchIndexException: Error encountered while searching for stores with the following query:
StoreLocationQuery{name=null, lat=43.767041210916226, lon=-78.79030851934817, zipcode=null, eligibilityCountryCode=null, radius=30000.0, orderBy=DISTANCE,    size=20, pageNumber=0, categoryIds=[], offerTypes=[], paymentTypes=[], incentiveCampaignIds=[]}
! at com.paypal.davis.server.search.ElasticsearchStoreSearchDao.searchStoreLocations(ElasticsearchStoreSearchDao.java:110) ~[places-server.jar:1.1.0]
! at com.paypal.davis.common.metrics.MethodTimer.invoke(MethodTimer.java:63) ~[places-server.jar:1.1.0]
! at com.paypal.davis.server.endpoints.StoresResource.findStores(StoresResource.java:59) ~[places-server.jar:1.1.0]
! at sun.reflect.GeneratedMethodAccessor128.invoke(Unknown Source) ~[na:na]
! at sun.reflect.DelegatingMethodAccessorImpl.invoke(DelegatingMethodAccessorImpl.java:43) ~[na:1.6.0_27]
! at java.lang.reflect.Method.invoke(Method.java:616) ~[na:1.6.0_27]
[…]
Example of a Java application’s logging output
HTTP Request
HTTP servers will typically output request logs in NCSA common log format:
127.0.0.1 user-identifier frank [10/Oct/2000:13:55:36 -0700] "GET /apache_pb.gif HTTP/1.0" 200 2326
127.0.0.1 user-identifier frank [10/Oct/2000:13:56:04 -0700] "GET /missing.gif HTTP/1.0" 404 2380
Example of a request log output
Log Aggregation
If your application is load-balanced between a number of different servers, each generating their own set of logs, then log aggregation becomes increasingly important. The process of simply using tail -f or grep on a single server won’t give you the whole picture, and opening many of these instances can quickly become overwhelming. Furthermore, giving SSH access of production machines to development team members isn’t ideal if they need to view the logs. Log aggregation can help address these issues by shipping log data from each disparate service/server to a central location.
Syslog, and the implementing syslog-ng, is one such system to help with aggregating. As a basic explanation, Syslog is a client/server protocol that defines how logging messages get transmitted from a service or system to a syslog receiver (also referred to as a syslogd or syslog server). Many loggers in Java, for example, have appenders that ship directly to syslog servers.
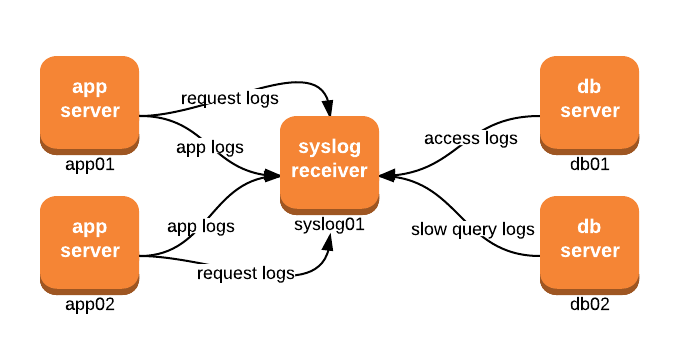
Typical Syslog setup
In this example, all the applications and systems are shipping different types of log data to syslog-server01. Now that all this data is centralized on that machine, anyone can use the usual tools (tail, grep, cat, less) to inspect these logs as easily as browsing a folder structure. Furthermore, access to certain files can be controlled by user accounts, or other OS methods, so that development teams can view production logs of their applications.
Log Aggregation with Indexing
Having logs centrally located is a great practice to establish, and for many companies or use-cases it might be enough. However, there’s a wealth of information in these log files that can only be tapped into when you index the text and make it searchable. Similar to how Google empowers you to query a vast amount of information on the internet, a searchable logging system will give you unparalleled insight into your systems via their log data.
logstash is one of many great systems for addressing this need. From the website, it’s description is:
logstash is a tool for managing events and logs. You can use it to collect logs, parse them, and store them for later use (like, for searching). Speaking of searching, logstash comes with a web interface for searching and drilling into all of your logs.
Check out Crash Course Into Open Source Monitoring - Part 4 (logstash) for an in-depth write up about logstash.