Crash Course Into Open Source Monitoring - Part 4
Logstash
As mentioned in my previous post, Crash Course Into Open Source Monitoring - Part 3 (Centralized Logging), Logstash is a great open source system for aggregating/indexing log and event data. Although the idea is pretty simple, the actual overview of a logstash deployment is fairly complex due to all the various inputs and ouptuts, possible configurations, and use cases the system can cover.
Components
A centralized logstash deployment includes a few components:
- Collector/indexer
- Shipper
- Web interface (Kibana)
- Elasticsearch
- Redis (optional)
Collector/Indexer
The collector/indexer is the central process of logstash, and it’s written in Java. It’s where all the data gets piped through, collected, processed, and then stored into Elasticsearch (for searching later). The configuration language is very powerful, and comes with many input/filter/output plugins. In the Example Topologies section, I’ll go over a few different deployments and tie together the plugins with their configurations.
Shipper
A logstash shipper is a process responsible for shipping logs. There are many implementations (including the one built into the logstash software package) that each address different needs such as:
- Configurability
- Low resource footprint
- Encryption
- Ease of deployment
- Language support, e.g. if your team primarily uses Python, it might be a factor for choosing a Python based shipper.
- Extensibility
Within the logstash software package, a shipper is the same executable as the collector/indexer, but configured with a different set of inputs/outputs. The one invariant is that the collector/indexer will always have Elasticsearch configured as an output, whereas the shipper does not always.
Web interface
Logstash comes with a great web interface called Kibana, written completely in JavaScript. It connects directly to the Elasticsearch server, and visually surfaces up some of the query capabilities, allowing you to search the logs stored by logstash.
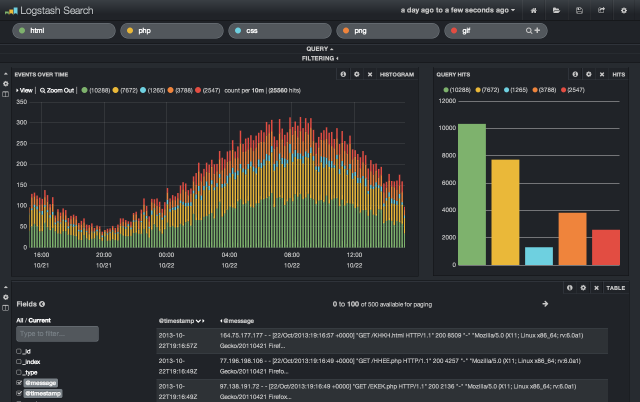
Kibana web interface demo running at: http://demo.kibana.org/#/dashboard
Elasticsearch
Logstash is built on top of Elasticsearch and as a result, can leverage many of the tools and powerful searching functionality from it, as well as its horizontal scalability. Since you can search across multiple indices in Elasticsearch, logstash uses this functionality and creates a new index every day. This way, you can optimize it when it rolls over (since it becomes immutable at this point), remove it after a certain number of days, or archive it for long term storage.
Redis (optional)
In the Getting Started (Centralized) guide, Redis is recommended to be set up as a broker between the shipper and collector/indexer. A broker can be thought of as a FIFO buffer, such as the one between CPU and RAM. Ideally, the collector/indexer should be able to process the Redis queue as quickly as it gets filled by the shippers, i.e. the queue should usually be empty, but is useful when bursts of activity happen.
Example Topologies
Below are just a few topologies for logstash deployments. Given its configurability, extensive plugin list, and the ease at which custom plugins can be created, there are many ways to “wire-up” logstash.
Redis Broker Setup
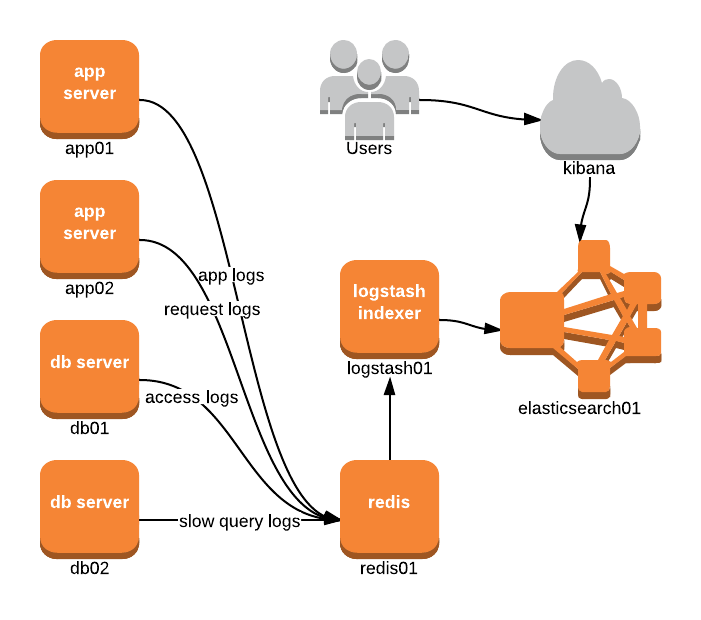
In this setup, each of the application and database servers output their different logs directly into redis01. The collector/indexer then connects to this Redis server, ingests/processes the data, then outputs it to elasticsearch01.
Users then view this data through the Kibana UI, which is simply a JavaScript application that connects directly to Elasticsearch.
input {
  redis {
    host => "redis01"
    data_type => "list"
    key => "logstash"
  }
}
output {
  elasticsearch {
    host => "elasticsearch01"
  }
}
logstash-indexer.conf example
Redis Broker and Lumberjack Setup
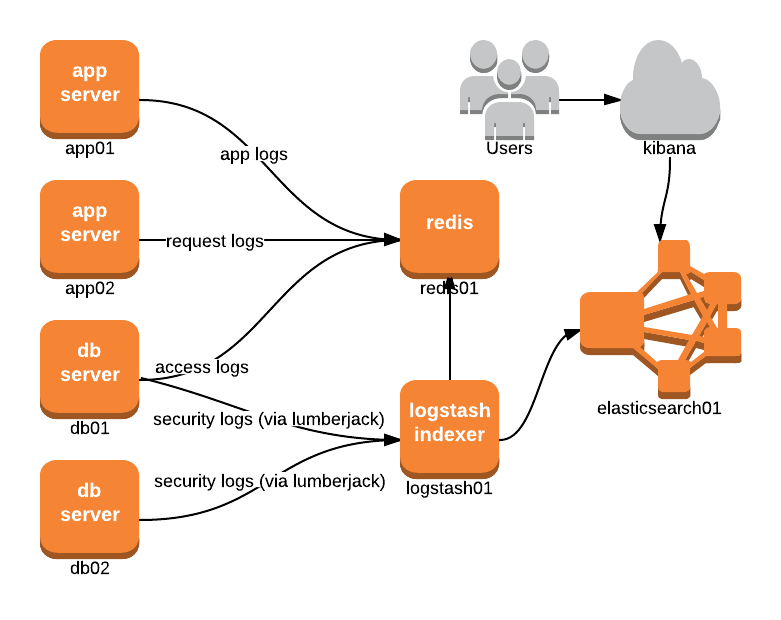
This is a similar setup to the previous except that logstash01 is configured with a new input type, lumberjack, that’s bound (arbitrarily) to port 12345. Other shippers are chosen when the Logstash built-in shipper isn’t a good fit.
lumberjack, for example, enforces SSL encryption, is a very light-weight daemon written in Go, runs with minimal resource usage, and deploys very easily. In this topology, Lumberjack’s encryption feature is very useful since it’s used to transmit sensitive security logs from the db servers to the indexer.
input {
  redis {
    host => "redis01"
    data_type => "list"
    key => "logstash"
  }
  lumberjack {
    port => 12345
    ssl_certificate => "/etc/ssl/lumberjack.cert"
    ssl_key => "/etc/ssl/lumberjack.key"
  }
}
output {
  elasticsearch {
    host => "elasticsearch01"
  }
}
logstash-indexer.conf example
Syslog-ng Setup
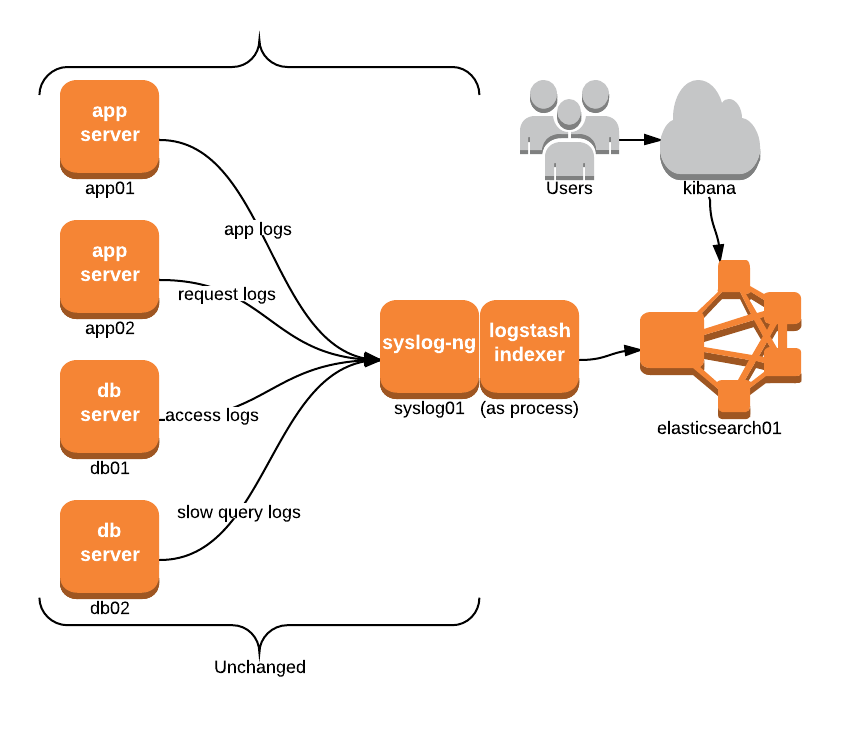
For some companies, a Syslog based setup might already be in place, and aggregating logs to a central server. It is usually desired to maintain the current setup, at least for some time.
In this example, the syslog receiver syslog01, and the methods for shipping logs, remains unchanged. However, to leverage logstash in this environment, we can run the collector/indexer as a process on the same server and have it output to elasticsearch01. The configured input used here can simply be the file input, which is similar to tail in Linux. We’d then configure the filter section to the Syslog message format, as explained in this logstash cookbook: parsing syslog messages.
input {
  file {
    path => "/var/syslog/*.log"
  }
}
filter {
# see "parsing syslog messages" cookbook
}
output {
  elasticsearch {
    host => "elasticsearch01"
  }
}
logstash-indexer.conf example
Logstash as the Syslog Server
In the last setup, we maintained the existing syslog receiver and had the logstash indexer process the collected log files. However, doesn’t it seem Logstash has the same functionality as syslog-ng? In fact it suppports1 being a receiver by configuring it with the syslog input, thereby replacing the existing receiver completely. Just simply bind it to the syslog port (defaults to 514), and no further changes should be needed. The diagram looks similar to the previous setup, but with a slight change:

input {
  syslog {
    port => 514
  }
}
output {
  elasticsearch {
    host => "elasticsearch01"
  }
}
logstash-indexer.conf example
Integration with Graphite and statsd
Logstash has a great tutorial titled Pull metrics from logs, which begins with the following:
Logs are more than just text. How many customers signed up today? How many HTTP errors happened this week? When was your last puppet run?
Apache logs give you the http response code and bytes sent - that’s useful in a graph. Metrics occur in logs so frequently there are piles of tools available to help process them.
Logstash can help (and even replace some tools you might already be using).
The tutorial explains how to configure logstash to process apache logs and emit counts of HTTP response codes to statsd using the plugin. Here’s what the topology could look like:
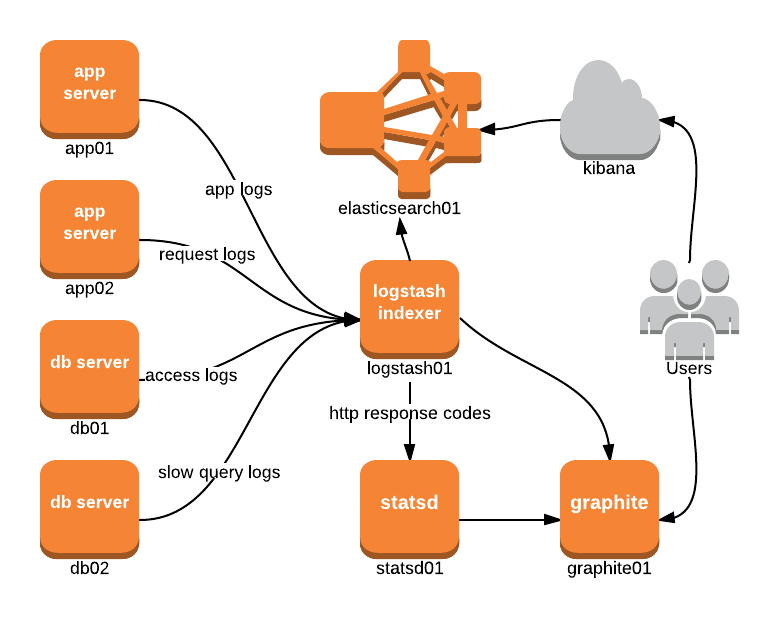
Notice how logstash01 outputs directly to both statsd01 and graphite01. The tutorial outlines the reasons for outputting to statsd, so when would you want to output to graphite? Well it turns out there are a few reasons:
- Since statsd is UDP based, there’s no guarantee on message delivery. In some cases, ensuring that a metric gets transmitted is needed so outputting straight to Graphite via TCP would be better.
- Graphite has an input protocol called pickle which is much more efficient for sending batches of metrics. Depending on how data arrives into logstash and processed, this might be the best method to use.
- Your infrastructure is not running statsd.
More Resources
- Logstash documentation: http://logstash.net/docs/1.2.1/
- 10-minute walkthrough: http://logstash.net/docs/1.2.1/tutorials/10-minute-walkthrough/
- Standalone server example: http://logstash.net/docs/1.2.1/tutorials/getting-started-simple
- Getting Started (Centralized): http://logstash.net/docs/1.2.1/tutorials/getting-started-centralized
- Logstash cookbook: http://cookbook.logstash.net/
- Visualizing Logdata with Logstash, Statsd and Graphite: http://blog.pkhamre.com/2012/07/05/visualizing-logdata-with-logstash-statsd-and-graphite/
-
As mentioned in the logstash docs for syslog input: “This input only supports RFC3164 syslog with some small modifications. The date format is allowed to be RFC3164 style or ISO8601. Otherwise the rest of the RFC3164 must be obeyed. If you do not use RFC3164, do not use this input.”
↩